Youless and Bidgely in the house
Around the end of the year we will get the final calculations from our energy supplier and you will know if your monthly bill was too high or too low the last year. My energy bill is quite expensive I think and that has mostly to do with me using a lot of energy (and all the taxes of course). When I log in to the website of Eneco I can see what the average usage of houses in my neighborhood is. I don’t run any server farms anymore (I did have a full 19” rack in the past) so I already cut down my usage a lot. Still I wanted to know how much power I was consuming and especially what I was using at night.
I happened to stumble up on the YouLess website last year. (not sure who mentioned it on Facebook or twitter). They sell a little device which you place on top of your energy meter and it counts the pulses so it knows how much power you are consuming real-time! The cool part is that is has a network connection too. Not sure what it is, but when little electronic devices have network connectors they become a lot more interesting suddenly.
Installing and configuring the YouLess
So I ordered one and received it 2nd of January. Installation was really easy. A sticker with a little hole in it was placed over my electricity meter with the hole over the little blinking light. I could place the YouLess device on top of that sticker (it uses Velcro).
The device is powered with a USB cable. A separate USB cable and connector is supplied with the device. I could plug in the USB cable in my router so it can power the YouLess like that. USB is only used to power the device. Communication is done through the Ethernet connection. You need to download a little tool to configure the ip address of the youless (only static ip address I am afraid) and after that you can browse to your little gadget.
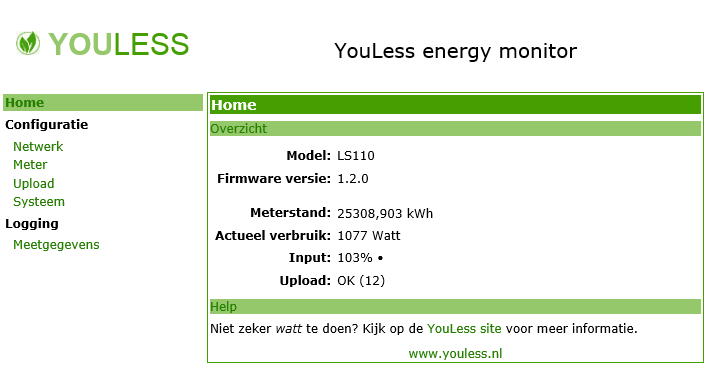
The input part displays if the YouLess can count the pulses correctly. You have to configure the YouLess for your specific meter as well.
In my case I have a digital (LED) meter which pulses 10000 times for every kWh usage.
Historic data using Bidgely
Well, that took 10 minutes tops and the YouLess was calculating realtime usage of my power. You can read out the historic data yourself (I will get to that in a bit) but you can also upload the data every 30 seconds to a free service called Bidgely. You need to get an account on that website. After that you can configure the YouLess to upload the data to this service. It automatically uploads your data. If the network connection is down, no problem, the YouLess stores 1 year of data automatically.
When you log in to the Bidgely site you immediately see some cool data. You now really understand why this data needs to be protected (there is a lot of discussion in the Netherlands around smart meters and their data).
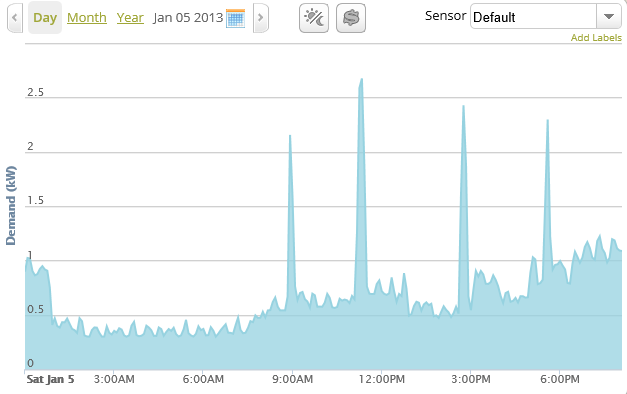
For example, lets take a look of the data in the chart above. This was during my holliday so it’s not a typical day for me but you can get some interesting data out of it.
On the left part you see the usage drop from around 900W to 400W, that’s around 1:00AM when I went to bed last night and switched off the lights and computer. At 2:00 it drops another 60-80W because my Synology NAS shuts down. At night it changes between 300W – 380W I need to figure out what is consuming that power. I have a wireless router. Fridge, Freezer some chargers etc. In the morning when we woke up we made some breakfast and I boiled water on the stove. That’s the 2000W spike you see around 9:00am. Around lunchtime my wife used the washing machine to do some laundry which is spike around 12:00am. My wife vacuumed the living room around 3:00PM (another 2000W spike) and around 6:00PM we cooked some spaghetti. Lights are on and the tv is on as well around this time so the average usage is a little higher than during the day. It’s pretty obvious at what time people are in the house using electric appliances or are at sleep looking at this chart.
I want that data for my app
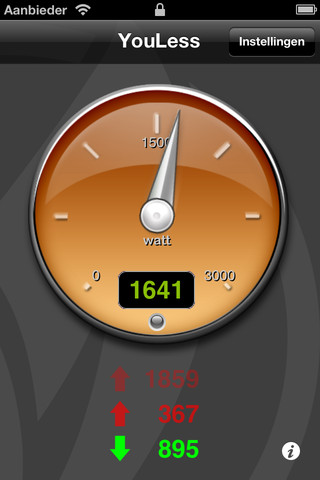
Whats cool about the YouLess, its storing historic data. You can also download an app for iOs and Android which shows you the realtime usage of your home. Hey, I am missing Windows Phone and Windows 8 🙁 let’s see if we can build that ourselves.
If you go to the data part of the YouLess you will see the data is available per month, per week, the last 8, 16 or 24 hours and the last 30 or 60 minutes. When you open one of the reports it looks like this:
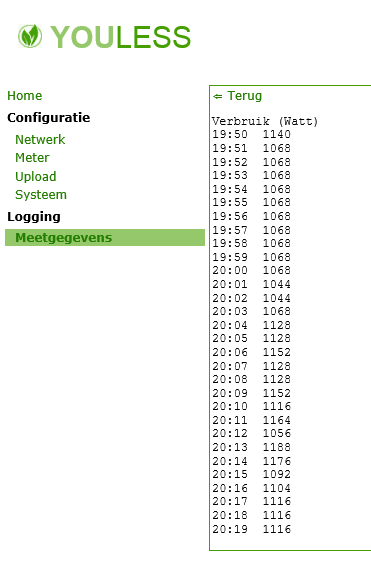
The URL is uses to open this report is http://
{“un”:”Watt”,”tm”:”2013-01-05T19:52:00″,”dt”:60,”val”:[” 1068″,” 1068″,” 1068″,” 1068″,” 1068″,” 1068″,” 1068″,” 1068″,” 1068″,” 1044″,” 1044″,” 1068″,” 1128″,” 1128″,” 1152″,” 1128″,” 1128″,” 1152″,” 1116″,” 1164″,” 1056″,” 1188″,” 1176″,” 1092″,” 1104″,” 1116″,” 1116″,” 1116″,” 1128″,” 1140″,null]}
You can get to the realtime data when you use http://
{“cnt”:”25309,428″,”pwr”:1111,”lvl”:103,”dev”:””,”det”:”•”,”con”:”OK”,”sts”:”(42)”,”raw”:0}
That’s the data which is used by the iPhone app to show you a little chart.
I think we can build a better Windows Phone and Windows 8 app for that :). I am building it right now, when it’s finished that’s another blogpost I will write.